James Dargan

Aspiring Data Scientist
Seattle, WA
Python, SQL, R
Actively searching 

Pandas, BeautifulSoup, Requests, Plotly, Dash, nltk, Sklearn, Keras
Regression, PCA, Time Series, Trees, RFs, SVMs, Boosting, Neural Networks
Selected Projects
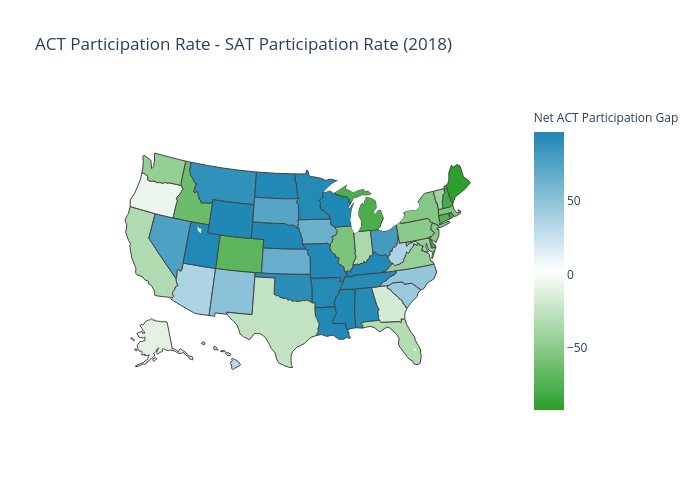
Exploring SAT and ACT State Averages (Repo)
I measure the impact of student self-selection into participation on college prep exams and explore the resulting bias introduced to state rankings based on state average scores using data scraped from various digest tables published by the NCES for the classes of 2017 and 2018. By incorporating case studies and analyzing changes between years, I demonstrate a causal connection between participation rates and state averages on the ACT and SAT. I produce a MLR with an adjusted R2 of 0.805 and mean absolute error of 0.68 points when explaining 2017 ACT scores, which predicts 2018 scores with a mean absolute error of 0.75 points.
My Medium Blogs on This Project:
Visualizing SAT & ACT Averages
Participation Rates Skew State Averages
Opt-In Bias Drives SAT & ACT State Averages
Estimating Classroom Impact on State Averages
Visualizing State Differences
Utilized Python and Plotly to collect data from online sources and create interactive U.S. Maps to compare state averages and participation rates on the SAT and ACT exams.
Predicting State Averages
Utilized Python and Stats Models to quantify the relationship between test participation rates and states averages, I demonstrate state rankings from these assessments misrepresent the relative quality of state education systems through the bias of student self-selection.
Modeling Impact of State Education System Features
Incorporating state level spending per student, average class size, and average teacher salary as a proxy for teacher quality, I model how these affect state performance on college admissions tests after controlling for participation. I show failing to account for the selection bias produces drastically biased coefficients and lower explanatory power.
AMES Housing Regression (Repo)
Provided with a variation of the classic AMES real estate dataset for a private Kaggle competition, I perform extensive EDA, impute missing values across 10 features including a regression imputation model, and engineer new features. I build an OLS on a selected subset of provided and engineered features which reaches an R2 score of 0.97. I demonstrate my OLS model outperforms L1 and L2 regularized models as well as principal components regression. I then buid a voting classifier based on OLS, Random Forest, and XGBoost models which improves test peformance by 10% as measured by root mean squared error.
Validation and Missing Imputation
I use pandas and missingno packages to identify missing values and inconsistent variable totals. I proceed to impute values for 30 observations across 10 features based on class probability estimation. I create a linear regression imputation model for lot frontage with an average margin of error of about 10%.
Regularization and PCA
I build an OLS model on selected and engineered features which delivers an R2 score of 0.967, a root mean squared error of 20,128, and mean absolute error of 9,777, which outperforms simple base models by 58% or more. I explore incorporating regularization and principal components into my linear model.
Reddit NLP Classification (Repo)
Utilizing Reddit’s Pushshift API, I collect posts and comments from the subreddits /r/pcgaming and /r/boardgames. I perform core NLP tasks, EDA of text content, and create a bag-of-words based predictive model to classify new posts with 98% accuracy.
Data Scrape and EDA
I build a pair of functions to collect post content from Reddit through its API. I explore the text content and functional features of subreddit activity.
Bag-of-Words Models
I tokenize, lemmatize, and employ CountVectorizer and TFIDF to prepare my collected data. I then use Logistic Regression, Multinomial Naive-Bayes, and Support Vector Classifiers to predict post subreddit with over 90% accuracy. I then compare the accuracy and model optimization computational time for each model with increasing layers of text content.
Domestic Flights
Digit Classification (Repo)
NMIST Convolutional NN
I create a walkthrough notebook on Kaggle that briefly explores the role of each layer in constructing a multilayer convolutional neural network which scores 0.98775 accuracy on the Kaggle test set. I demonstrate keras tools to view network architecture, visualize activation layers applied on test data at each stage, and generate confusion matrices.
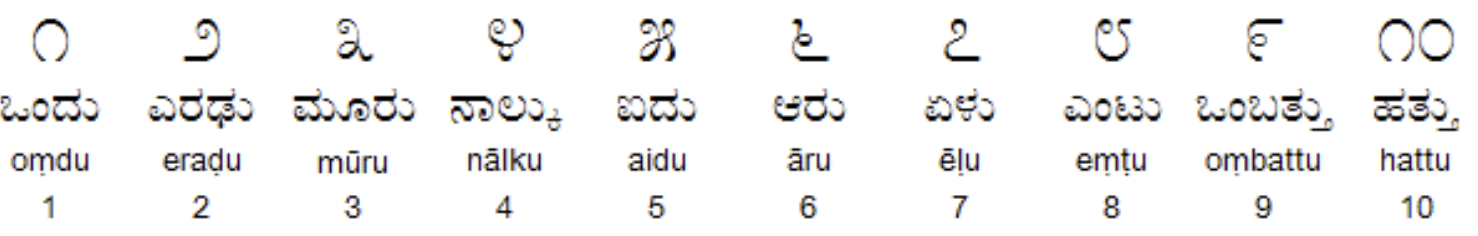
Step-by-Step Optimization of CNN with Kannada and Arabic Digits
I combine the Kannada and Arabic handwritten digit datasets and empirically test and optimize each component of a CNN architecture to build a model with 98.692% test accuracy across 20 digit categories. I then explore error introduced by similarities between digits across languages.
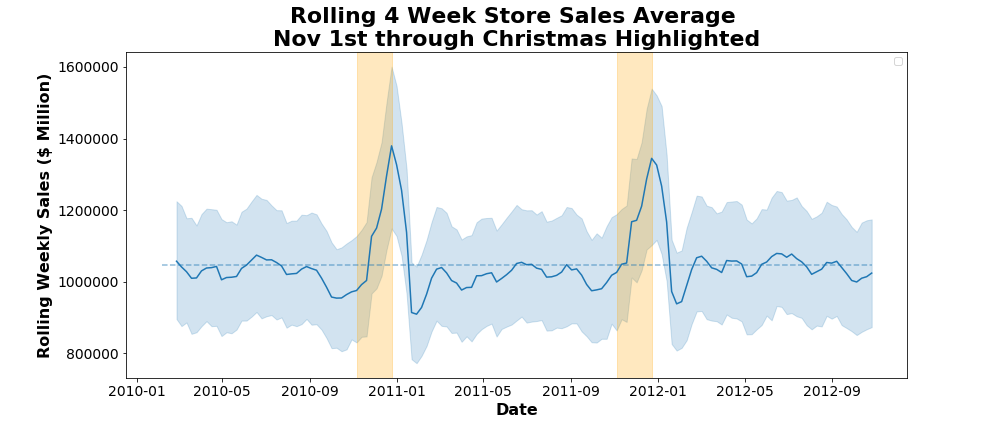
Walmart Store Sales (Repo)
EDA of Weekly Sales
I explore trends in Walmart sales at the store level over time, demonstrating stationarity and identifying good candidates parameters for a SARIMA time series model.
Optimizing a SARIMA Forecast
Utilizing 3 stores as case studies, I explore SARIMA model parameters, residual patterns, and overall performance at the individual store level in predicting weekly sales. I find an optimal model structure for each store to forecast sales with a mean absolute percent error of 2.77, 3.13, and 3.60 respectively. I then limit historical data reach and extend forecast distance to more closely simulate practical business conditions, retaining prediction error within 5%.
Utilizing 45 stores, I systematically optimize a SARIMA structure for all stores with adjustments for special-cases. I explore adding exogenous variables such as changes in fuel prices without success. I simulate a real-world business context to evaluate my model and find an average test mean absolute percent error of %.
Page template forked from evanca