James Dargan

Aspiring Data Scientist
Seattle, WA
Python, SQL, R
Actively searching 

Pandas, BeautifulSoup, Requests, Plotly, Dash, nltk, Sklearn, Keras
Regression, PCA, Time Series, Trees, RFs, SVMs, Boosting, Neural Networks
State Investment Improves Averages (Repo)
Project Component: I collect state data on average class size, spending per student, and teacher salary to improve prediction accuracy of state average scores. I find the selection-bias affecting state SAT averages can lead to a flawed perception of how classroom characteristics impact student performance. Estimates of these features’ coefficients change drastically after controlling for state participation rates. By including these additional features in a MLR model, I improve my adjusted R-square to 0.80 and reduce my mean absolute error to 0.71, a 20% reduction compared to the single variable model.
My Medium Blogs on This Project:
Visualizing SAT & ACT Averages
Participation Rates Skew State Averages
Opt-In Bias Drives SAT & ACT State Averages
Estimating Classroom Impact on State Averages
Insight 1: SAT averages correlate negatively with positive classroom trends. When viewed in isolation, state SAT averages display a negative trend with spending per student and teacher salary while showing no relationship with class size. This results directly from a cluster of low-participation, high-average states exerting undue influence on OLS.
Insight 2: Controlling for participation reverses relationships with SAT averages.
Class Size: coefficient -2.22 becomes -4.64, p-value 0.64 become 0.06
Spending per Student: coefficient -5.73 becomes 3.64, p-value 0.079 becomes 0.059
Teacher Salary: coefficient -3.31 becomes 1.07, p-value 0.01 becomes 0.19
Insight 3: Spending per student provides no value after controlling for class size and teacher salary Due to its high correlation with all other features, I use Principal Components Regression to fit a full model. I find this model performs no better than an OLS model without this feature included. The PCA breakdown supports the conclusion this feature adds no independent value.
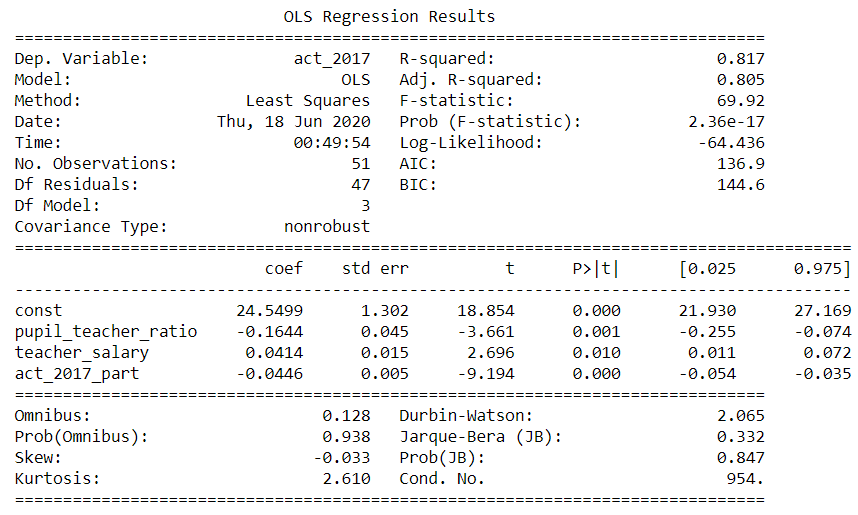
Full Linear Predictive Model My full model with teacher salary and class size added increases the adjusted R-squared by 7 points compared to using participation rates alone, with all features statistically significant at the 99% confidence level. It predicts 2017 ACT state averages with a mean absolute error of 0.68 points, a 20% improvement compared to using participation rates alone. This model predicts 2018 ACT state averages with a mean absolute error of 0.75 points, which translates to an average error margin of 3.5% relative to the true 2018 state average. Out of 51 predictions, 35 fell within 5 percent of the true 2018 state average. The largest error missed by only 2.39 points, or 11.5 percent.
Why It Matters: If a policy researcher naives treats test averages as representative of state education and fails to control for participation rates, the resulting analysis will produce invalid results and misleading conclusions. Any work with aggregate statistics must begin with investigating the data collection process and sources of bias that will skew these statistics.
Previous Project Page: Predicting State Averages